Crypto Bubble 2025: Bitcoin vs. Altcoins – What Investors Must Know Now

Diederick Jacobs
01-04-2025
7 min to read
Crypto Bubble or Evolution? Why Bitcoin's Ascent and Altcoin Chaos Are Redefining the Market in 2025
Key Takeaways
Not All Bubbles Pop the Same Way
While the DotCom Bubble saw a unified rise and crash, today's crypto market is fragmenting—Bitcoin is climbing institutional ladders while altcoins are left scrambling for attention, funds, and purpose.
From FOMO to Faux Millionaires
Celebrity memecoins and TikTok-fueled rug pulls have turned parts of the altcoin market into a Ponzi-style casino, where hype trumps fundamentals, and 13-year-olds are making headlines—by rugging.
The Flight to Quality Is Real
Bitcoin is no longer “just another coin”—it’s evolving into digital gold 2.0, increasingly decoupled from the chaos below it. ETF flows are treating it like an asset class of its own.
Venture Capital's Sobering Hangover
After gorging on altcoin deals in 2021, VCs have entered a phase of capital detox. Fundraising is up in quantity, but down in quality, showing that smart money is becoming much pickier.
Introduction
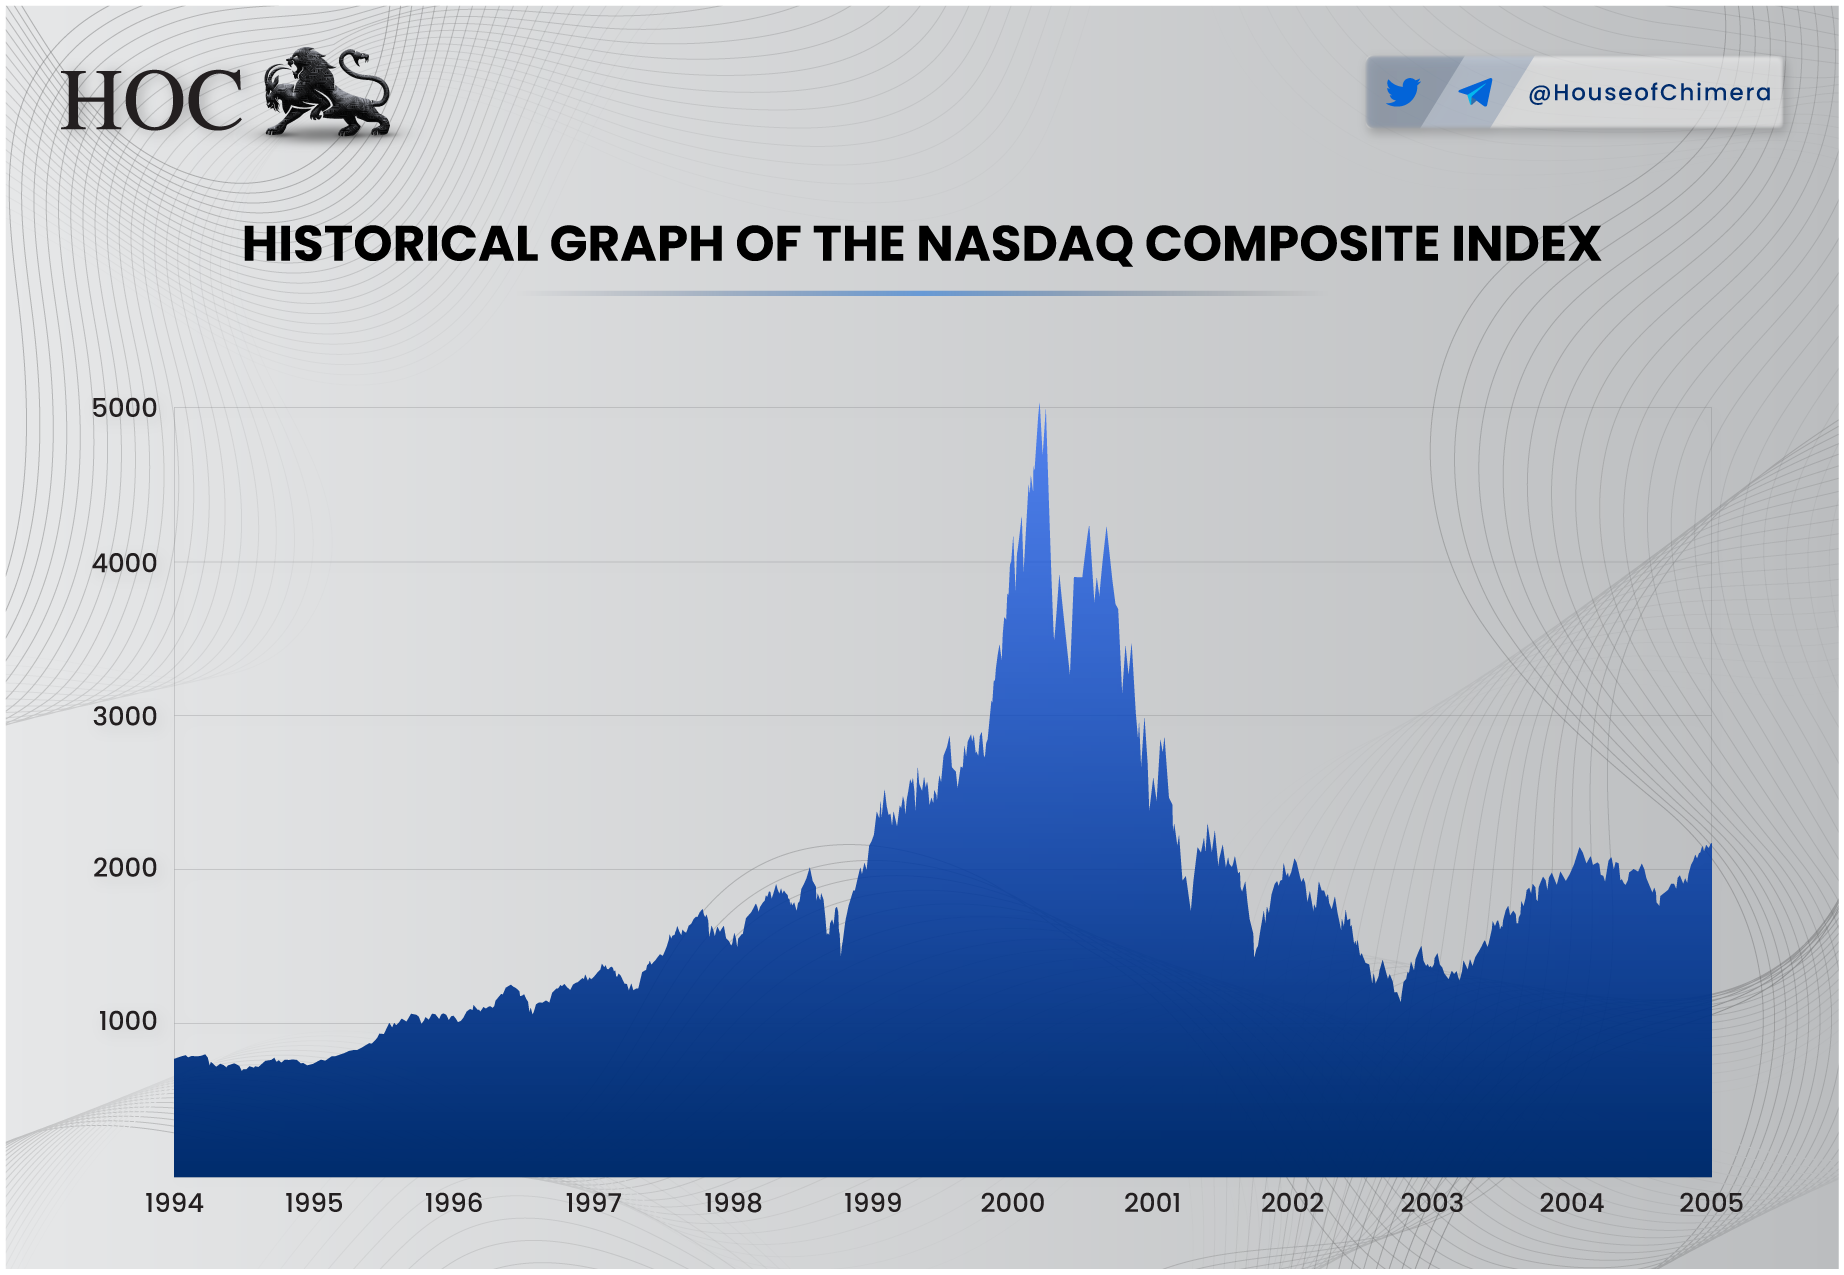
One of the most brought-up comparisons by critics of the Cryptocurrency Industry is to the now-infamous DotCom Bubble. The Nasdaq shed over 75% of its value, wiping out a casual 5 trillion USD in marketcap. No more Pets.com, Boo.com, and Worldcom, as they all went down the drain in the DotCom Bubble. Will Cardano, Solana, Bitcoin, and Ethereum have similar fate?
What was the DotCom bubble?
The Dotcom Bubble was a stock market bubble fueled by the widespread adoption of the World Wide Web, or the Internet. The bubble followed a typical ‘bubble path’, whereby Venture Capitalists poured billions of USD into startups, leading to rapid valuation growth and a rapid increase in the Nasdaq index. The significant increase in capital accessibility led to a period of excessive speculation and overvaluation of internet-based companies that came to an end in March 2000. The main driver of the speculation was the belief that the Internet would revolutionize how we live and work, which it eventually did, as there are over 5.56 billion Internet users.
But despite the wide success of the current Internet, we still had the Dotcom Bubble; why?
The bubble was fueled by a combination of factors, including the rapid acceleration in technological advancements and a significant adaptation rate, which led to an over-optimistic overview of the near future. To further add to the toxic cocktail, the cost of debt (e.g. interest rates) was relatively low in the 1990s, making it fairly cheap and accessible to acquire debt financing. To put the bubble into perspective, many companies were significantly overvalued, with some trading at Price-to-Earnings (P/E) ratios of 200 or higher. A P/E ratio of 200 implies that, assuming constant earnings, an investor would take 200 years to recoup their investment through company profits alone.
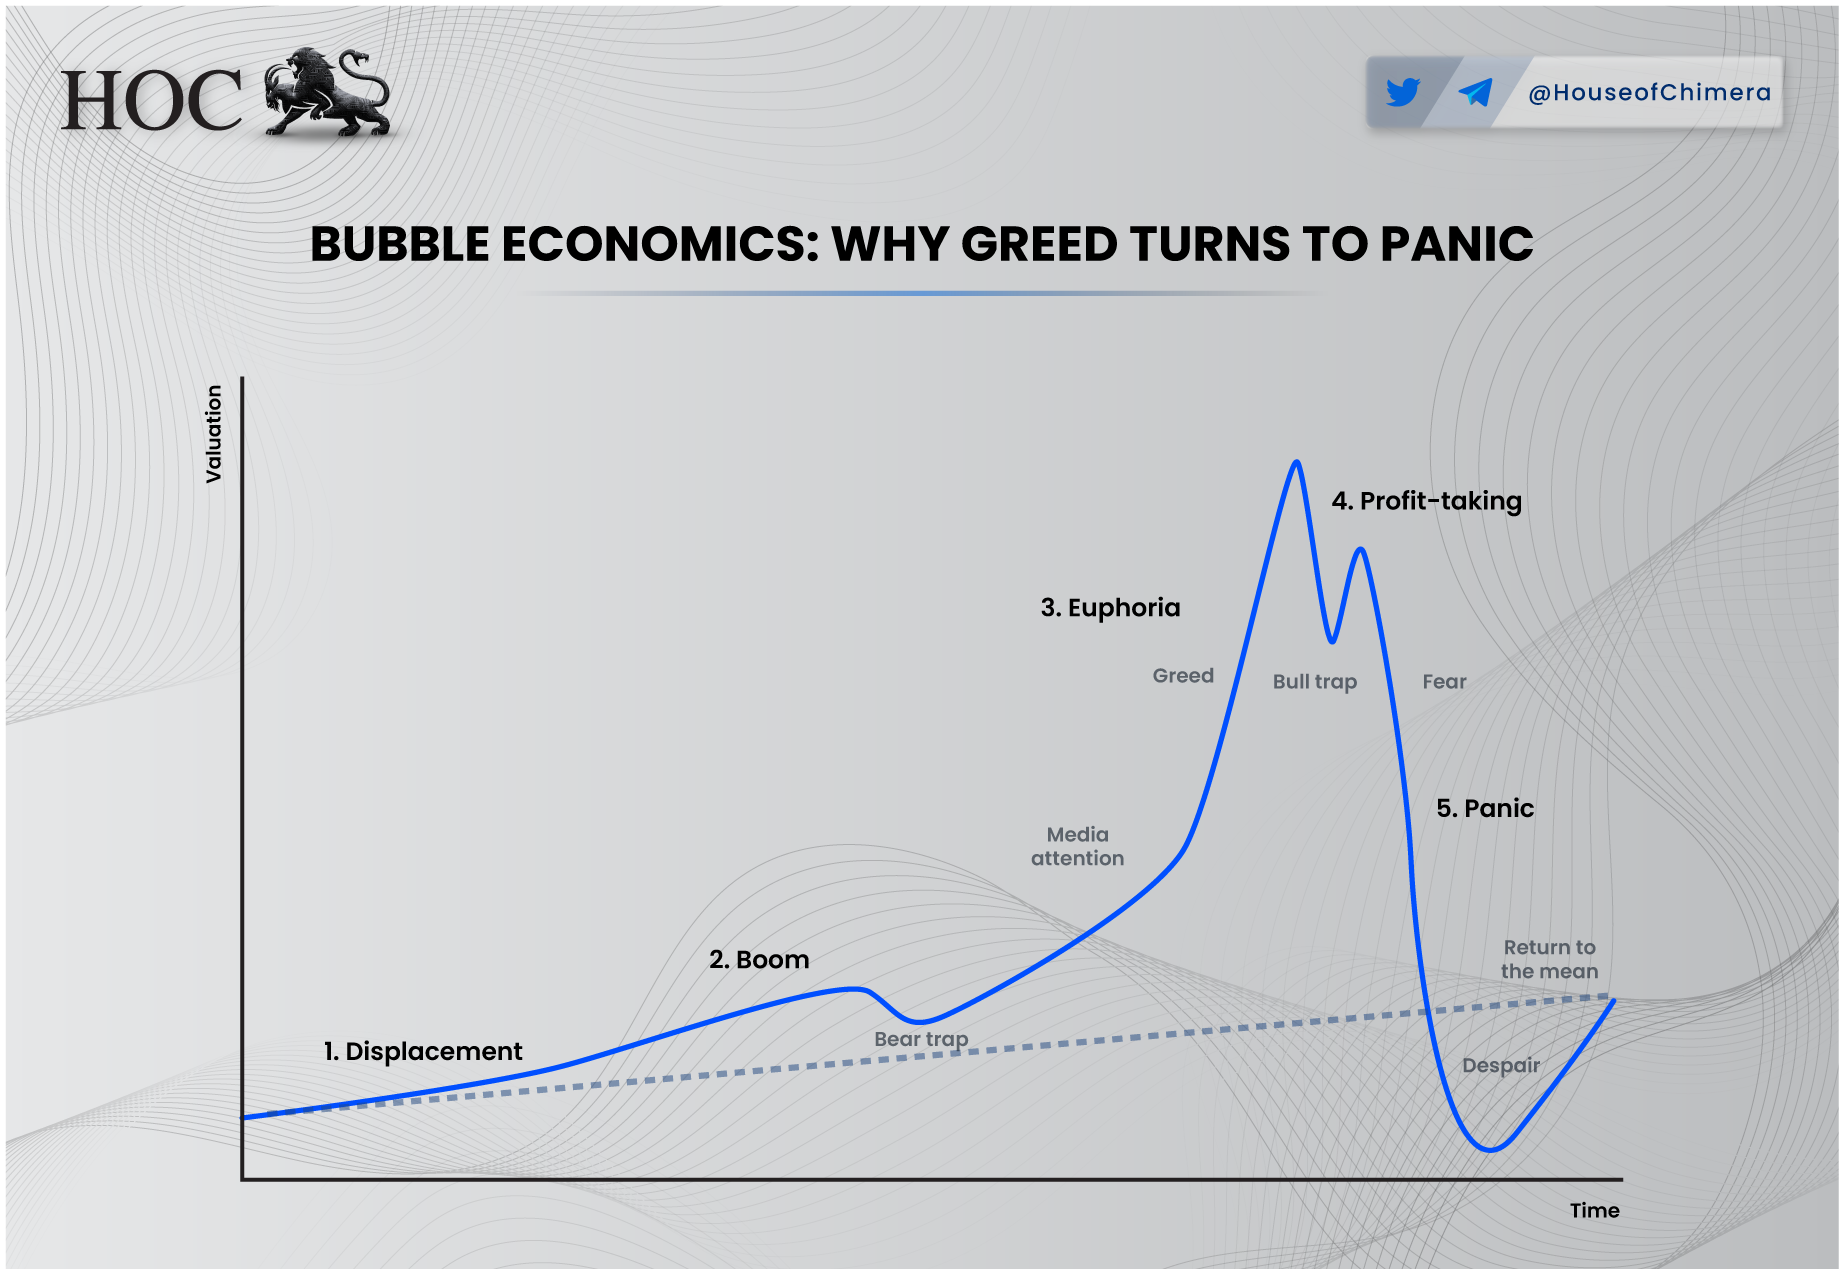
The psychology of Bubbles (in a nutshell)
Like any mirage, the smoke and mirrors cannot last forever. Eventually, the smoke will disappear, and the collective realization will catch up. The interesting part of bubbles is that they are notoriously hard to predict when they will burst. Traditional Finance models assume that the investor (yes, that’s you, degen) is rational; unfortunately, the cryptocurrency industry is nowhere close to rationality (do you remember the NFT hype? Oops).
The characteristics of a bubble are key to understanding the psychology behind a bubble:
- Irrational Exuberance: This term refers to the undue and baseless optimism investors exhibit during a bubble's expansion. Investors buy more assets in the hope of a price increase rather than the intrinsic value of the underlying asset.
- Fear of Missing Out: The social anxiety, and often peer-pressure, that fuels a bubble to the next level. The feeling that others are quickly increasing capital gains, while you are sidelined, which leads to more and more capital flowing in to capture the ‘opportunity’
- Leverage Increase: Investors tend to borrow more money to invest in a booming market, as they want to capture the opportunity.
- Open interest will increase: As more investors flock to the market, more positions will be opened in the futures/options market.
- Disconnect from Fundamentals: Investors are flocking to the market because of an ‘opportunity’; the price drives asset value, or speculation. The fundamentals are not necessary anymore.
- Normies coming in: Bubbles, due to their explosive nature, capture the public's attention, as they often rise rapidly. The media amplifies the optimism, drawing normies into the bubble, hoping to capitalize on the boom (FOMO on steroids).
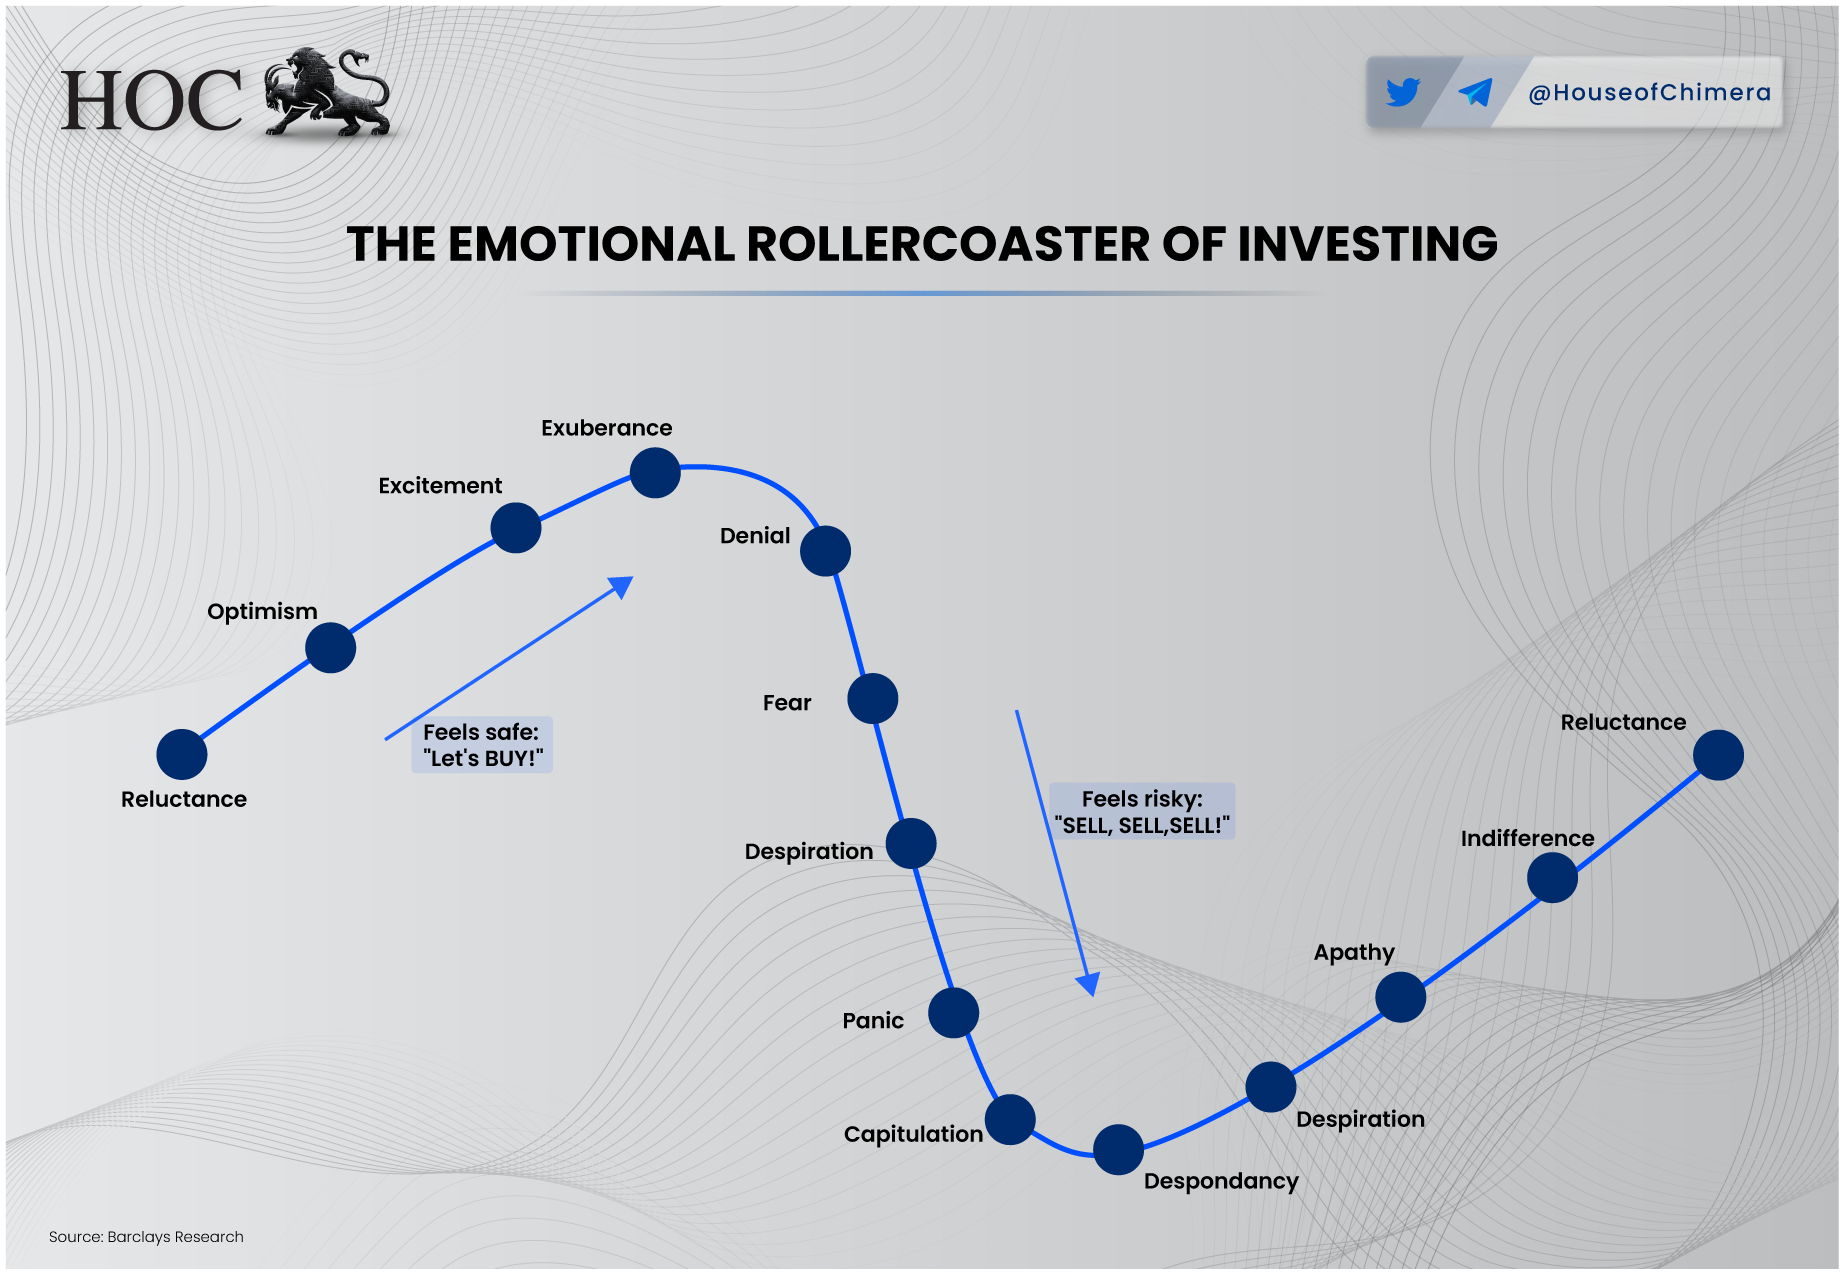
The driving force behind a bubble is greed and the illusion of easily accessible wealth, which flows out of overconfidence and overoptimism.
Overconfidence
Overconfidence arises when investors believe they understand the market well enough to outperform it. In reality, they’re often just riding a broader upward trend. This illusion of knowledge leads to increased trading activity, under the belief that they can consistently beat the market. Early success reinforces this belief—since nearly everyone profits during a bull run, it fuels self-attribution bias. More capital is deployed, inflating the bubble further. The Dunning-Kruger effect plays a role here: less competent investors tend to vastly overestimate their abilities, while more knowledgeable ones are cautious. As inexperienced investors grow, a self-reinforcing echo chamber takes shape.
Overoptimism
Overoptimism occurs when investors overrate the future potential of an asset, focusing solely on positive outcomes and assuming the price will continue to rise indefinitely. This mindset leads to ignoring fundamentals and warning signs. As the echo chamber grows louder, price becomes the dominant narrative, bolstered by stories of average individuals becoming overnight millionaires. The belief that “everyone will get rich” blinds investors to downside risks, which are minimized or outright dismissed. The result is a FOMO-driven culture, where people encourage others to buy in, effectively setting the stage for the greater fool theory, leaving latecomers as exit liquidity.
Translating this to crypto
Numerous economists and renowned investors have labeled the cryptocurrency market as a bubble. Eight Nobel Prize winners, including Paul Krugman, have described Bitcoin as a speculative bubble. This view is echoed by high-profile figures like Jack Ma (Alibaba), Jamie Dimon (JP Morgan), Warren Buffett (Berkshire Hathaway), and George Soros (Soros Fund).
On the other hand, the crypto community often rallies behind prominent Bitcoin advocates such as Michael Saylor (MicroStrategy), Donald Trump (current U.S. President), and Brian Armstrong (Coinbase), among others.The question arises: Who will be on the right side of financial history? While this is a complex question, bubbles are notoriously complex to predict. However, we can use a few tools to determine a good outlook on whether Bitcoin and/or the cryptocurrency market is truly a bubble.
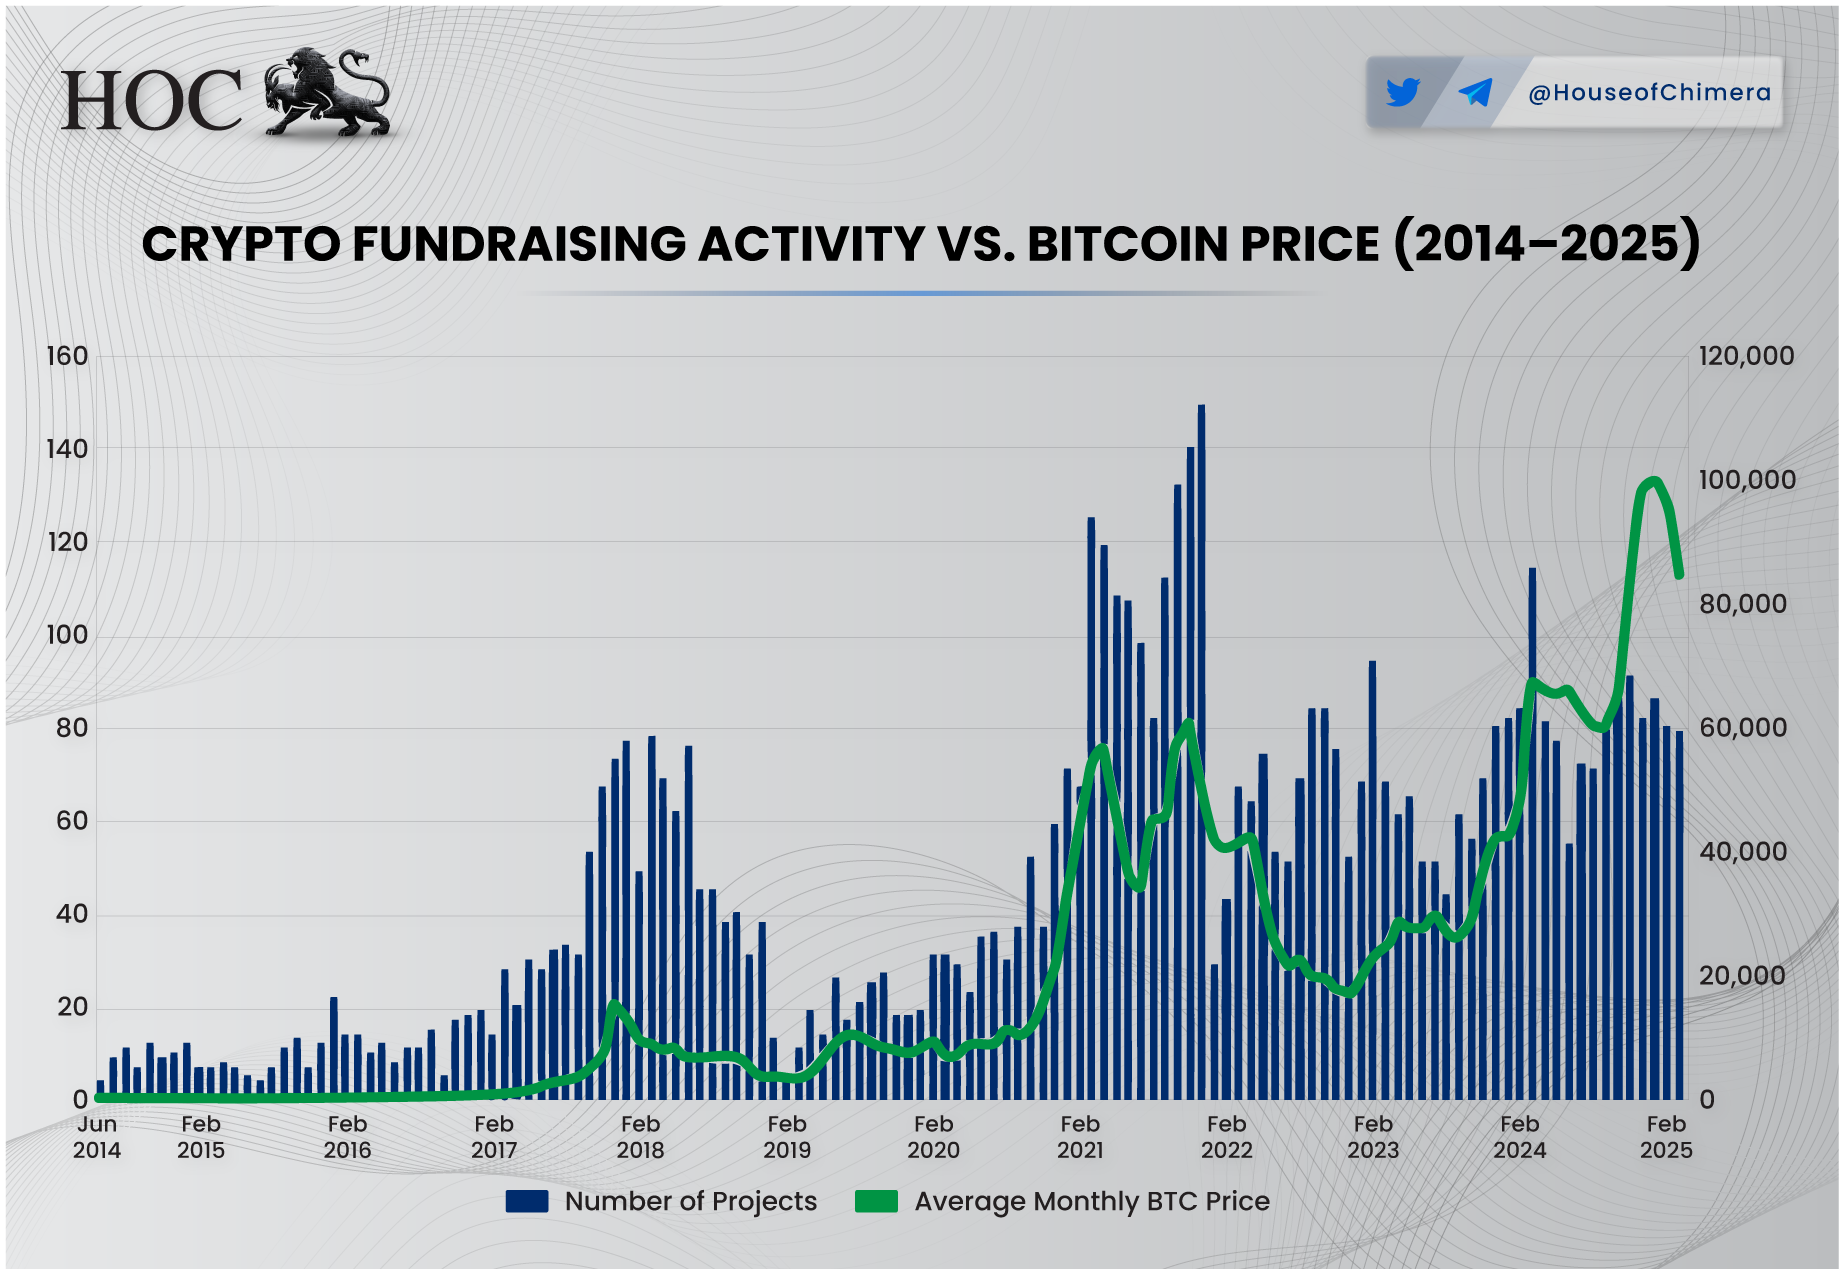
Let’s start by examining the fundraising data within the cryptocurrency industry. The graph above displays all publicly announced fundraising events from 2014 through February 2025. Notably, there’s a clear correlation between Bitcoin’s price and the number of fundraising announcements—projects tend to go public with their funding rounds when overall market sentiment is positive. This is intuitive, as announcing a raise during bullish conditions generally attracts more attention and credibility.
However, something curious happened during the last cycle, from 2022 to late 2023. Despite Bitcoin trading at relatively low levels, fundraising announcements remained high. One explanation is that many of these projects had already secured funding earlier, likely during stronger market conditions. They waited to announce their raises until sentiment began to turn more positive. In other words, they timed their announcements to coincide with Bitcoin’s upward trend, even if its absolute price was still relatively low.
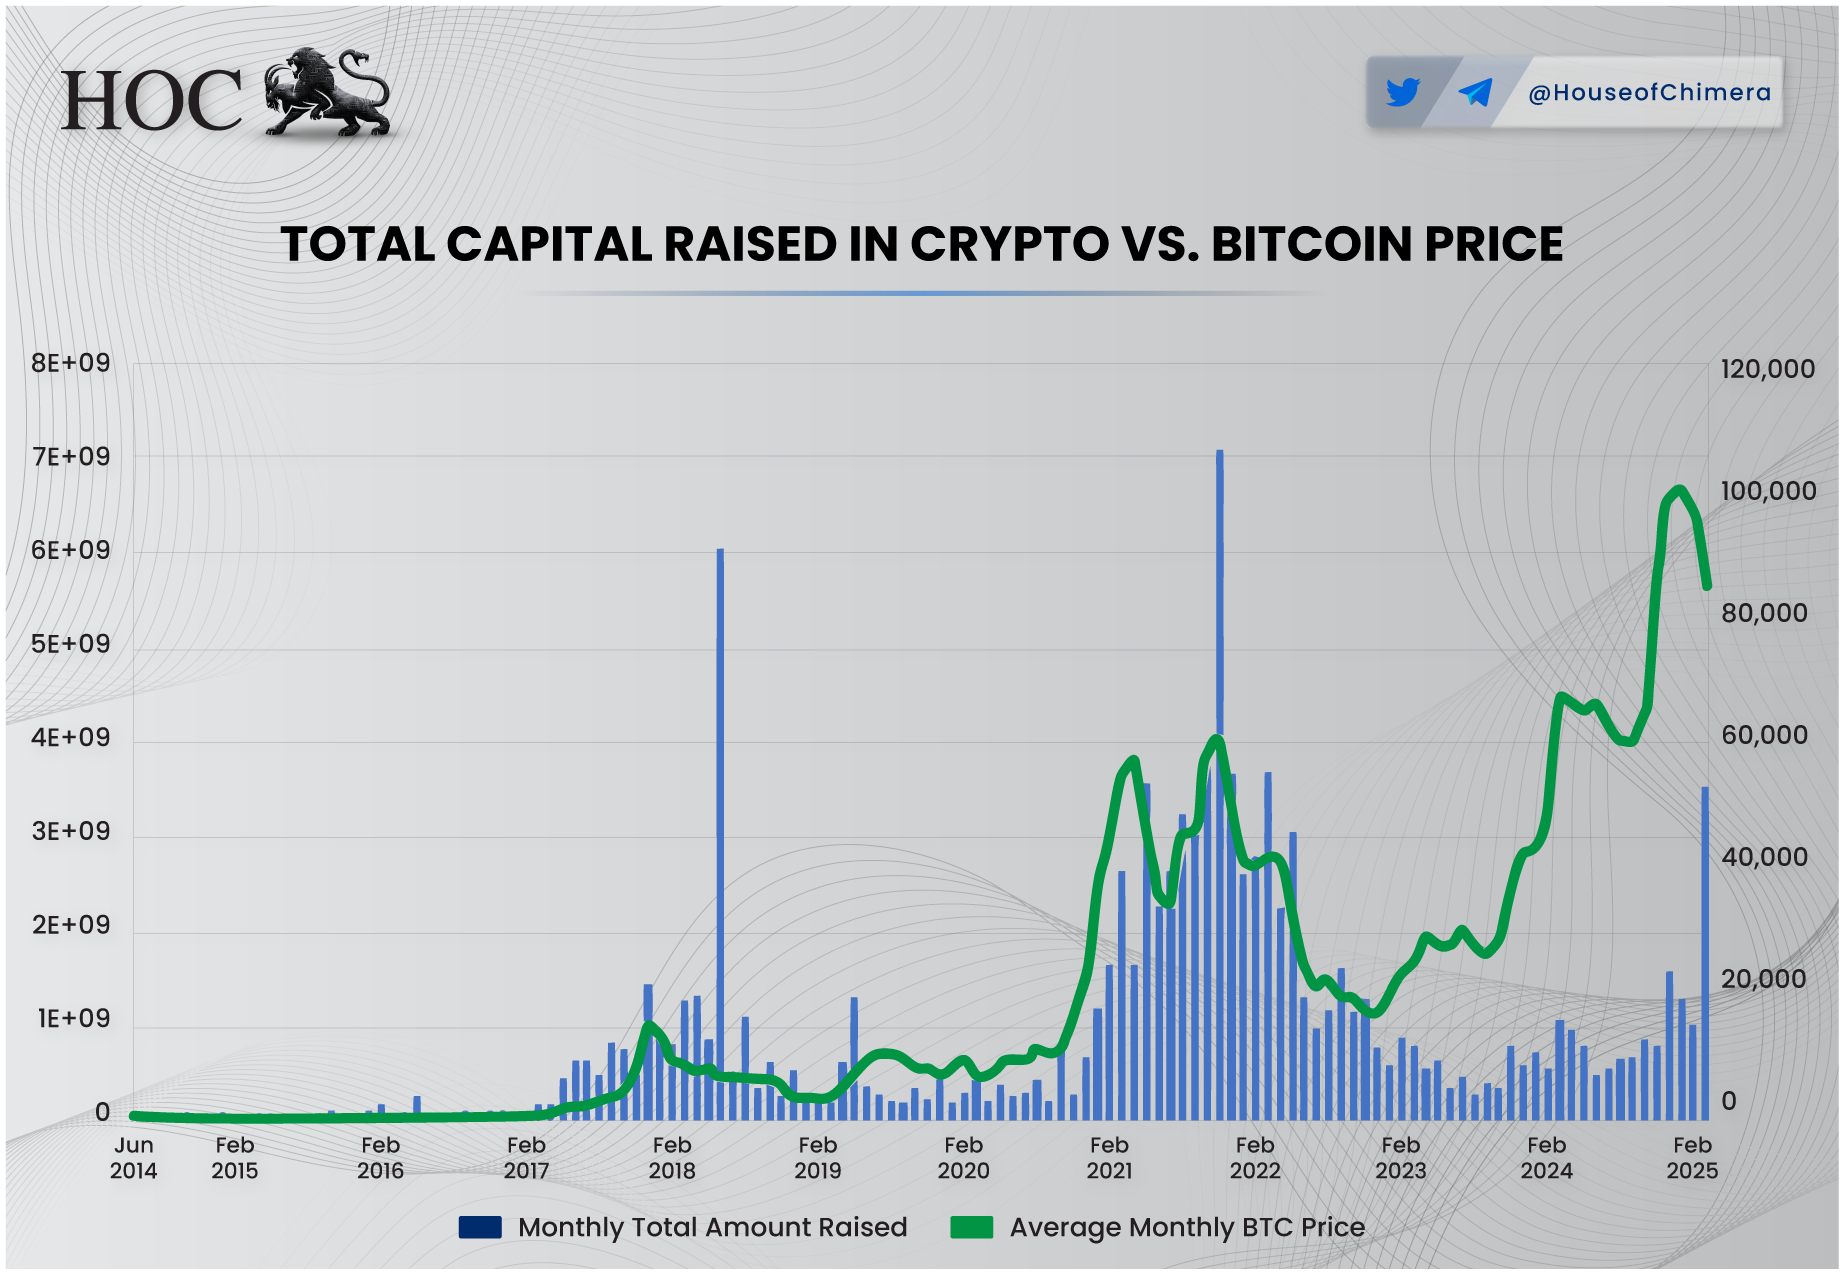
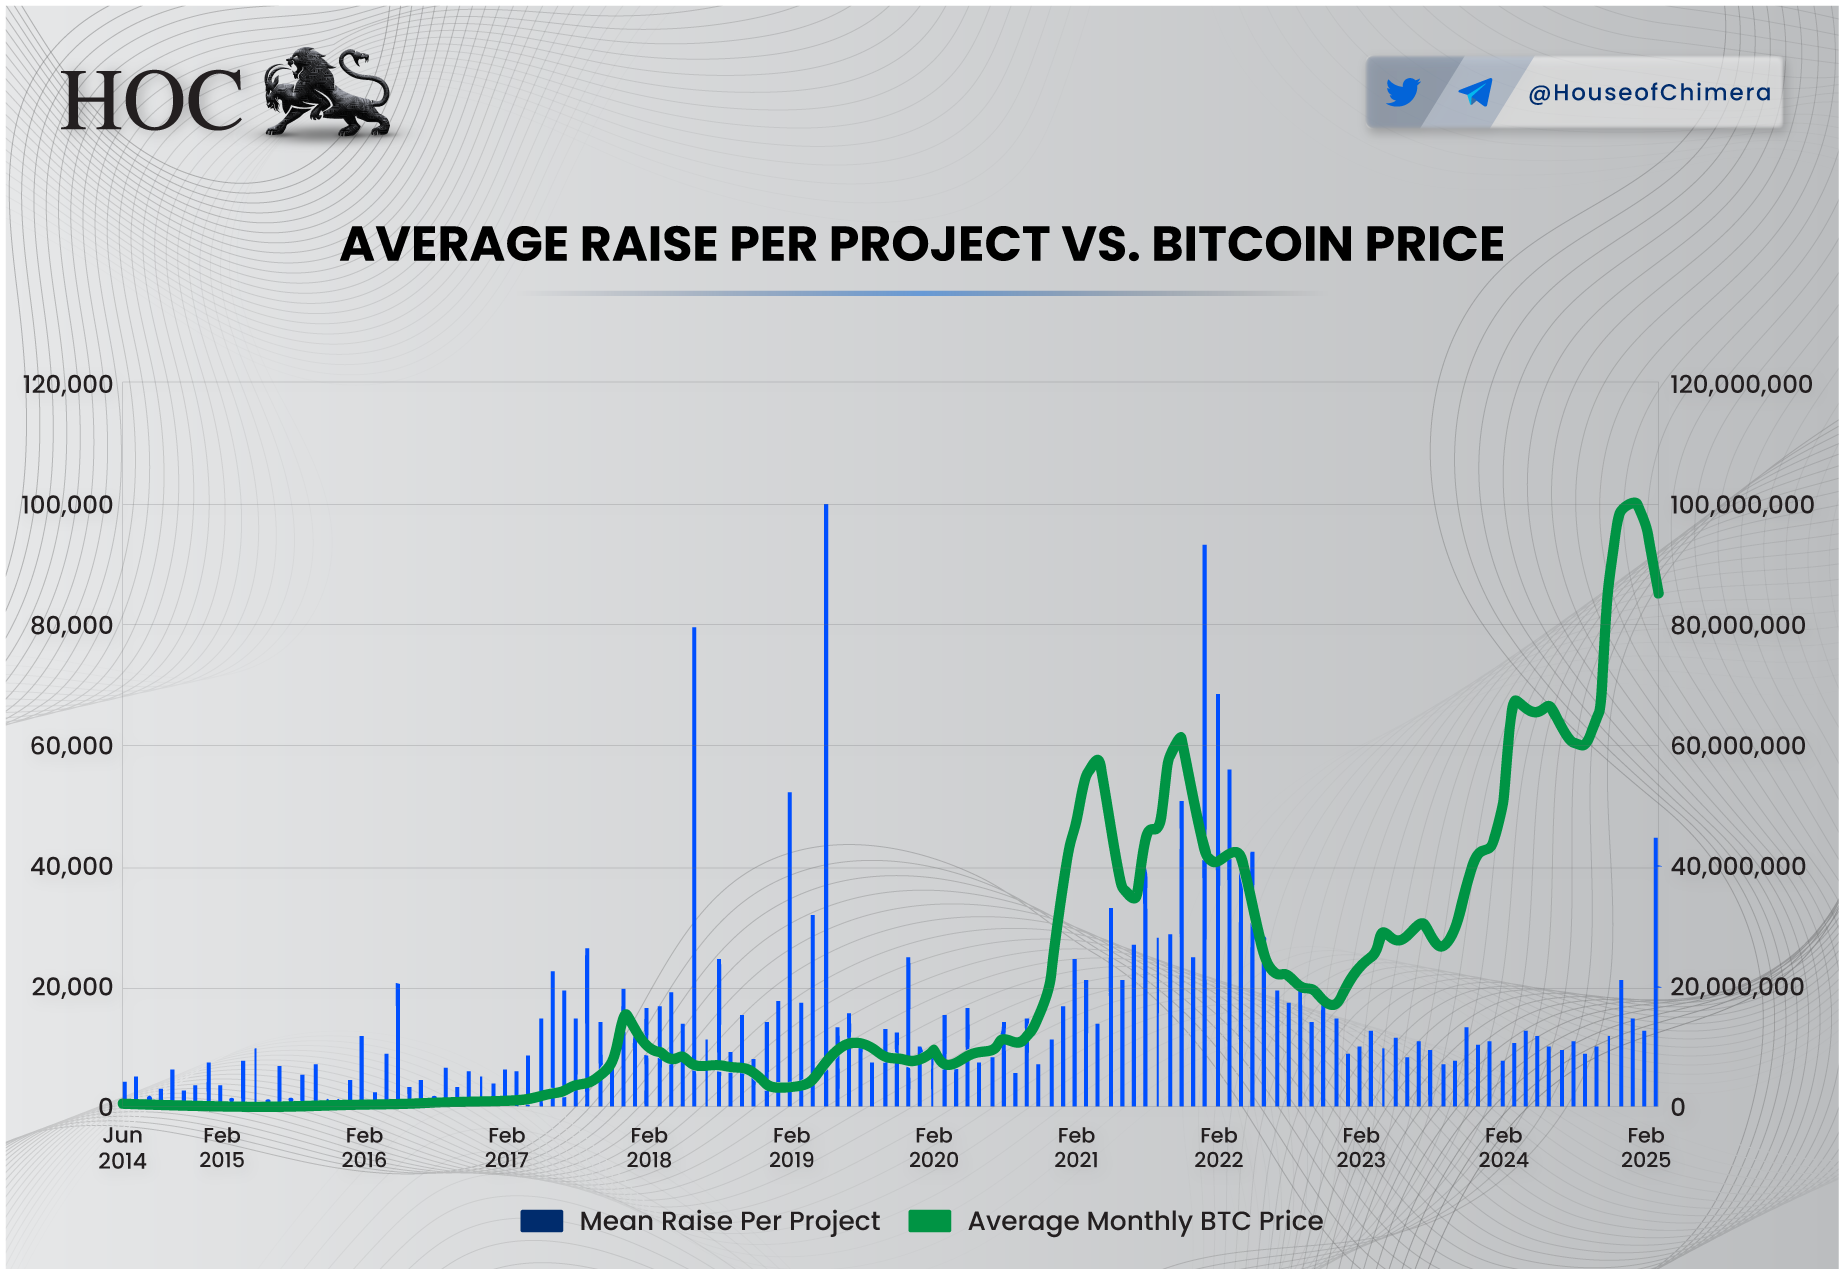
Yet, looking solely at the number of deals may give us a limited perspective. To get a clearer picture, we must go deeper into the data to determine if there’s a potential structural break. Interestingly, the correlation between the total monthly funds raised and Bitcoin’s average monthly price became negative in early 2022. While the number of deals held steady, the total capital raised dropped sharply and has only recently begun to recover.
This suggests that the average fundraising amount per project declined significantly during this period. This does not align with our earlier point that projects may have delayed their announcements until sentiment improved. If that were the case, we expect the average raise to remain relatively stable, since the fundraising would have occurred during more substantial market periods (e.g., 2021). Instead, the data indicates that many projects were likely raising smaller amounts in a weaker market environment, rather than simply timing their announcements for more favorable sentiment. The reason for the smaller raising amounts was that the venture capitalists were sidelined, or were locked into deals made in 2021.
In 1999 to 2000, the peak of the Dotcom bubble, there was one apparent trend: the number of deals and total investment skyrocketed. Even so, there were so many deals that even in 2017, the total investment amount was still approximately 40% lower than in the peak of the Dotcom bubble. The FOMO feeling combined with over-optimism and confidence led to a toxic cocktail of venture capitalists flocking to the markets to make highly financially risky and often baseless investments, further strengthening the bubble effect. Eventually, the bubble collapsed in 2001.
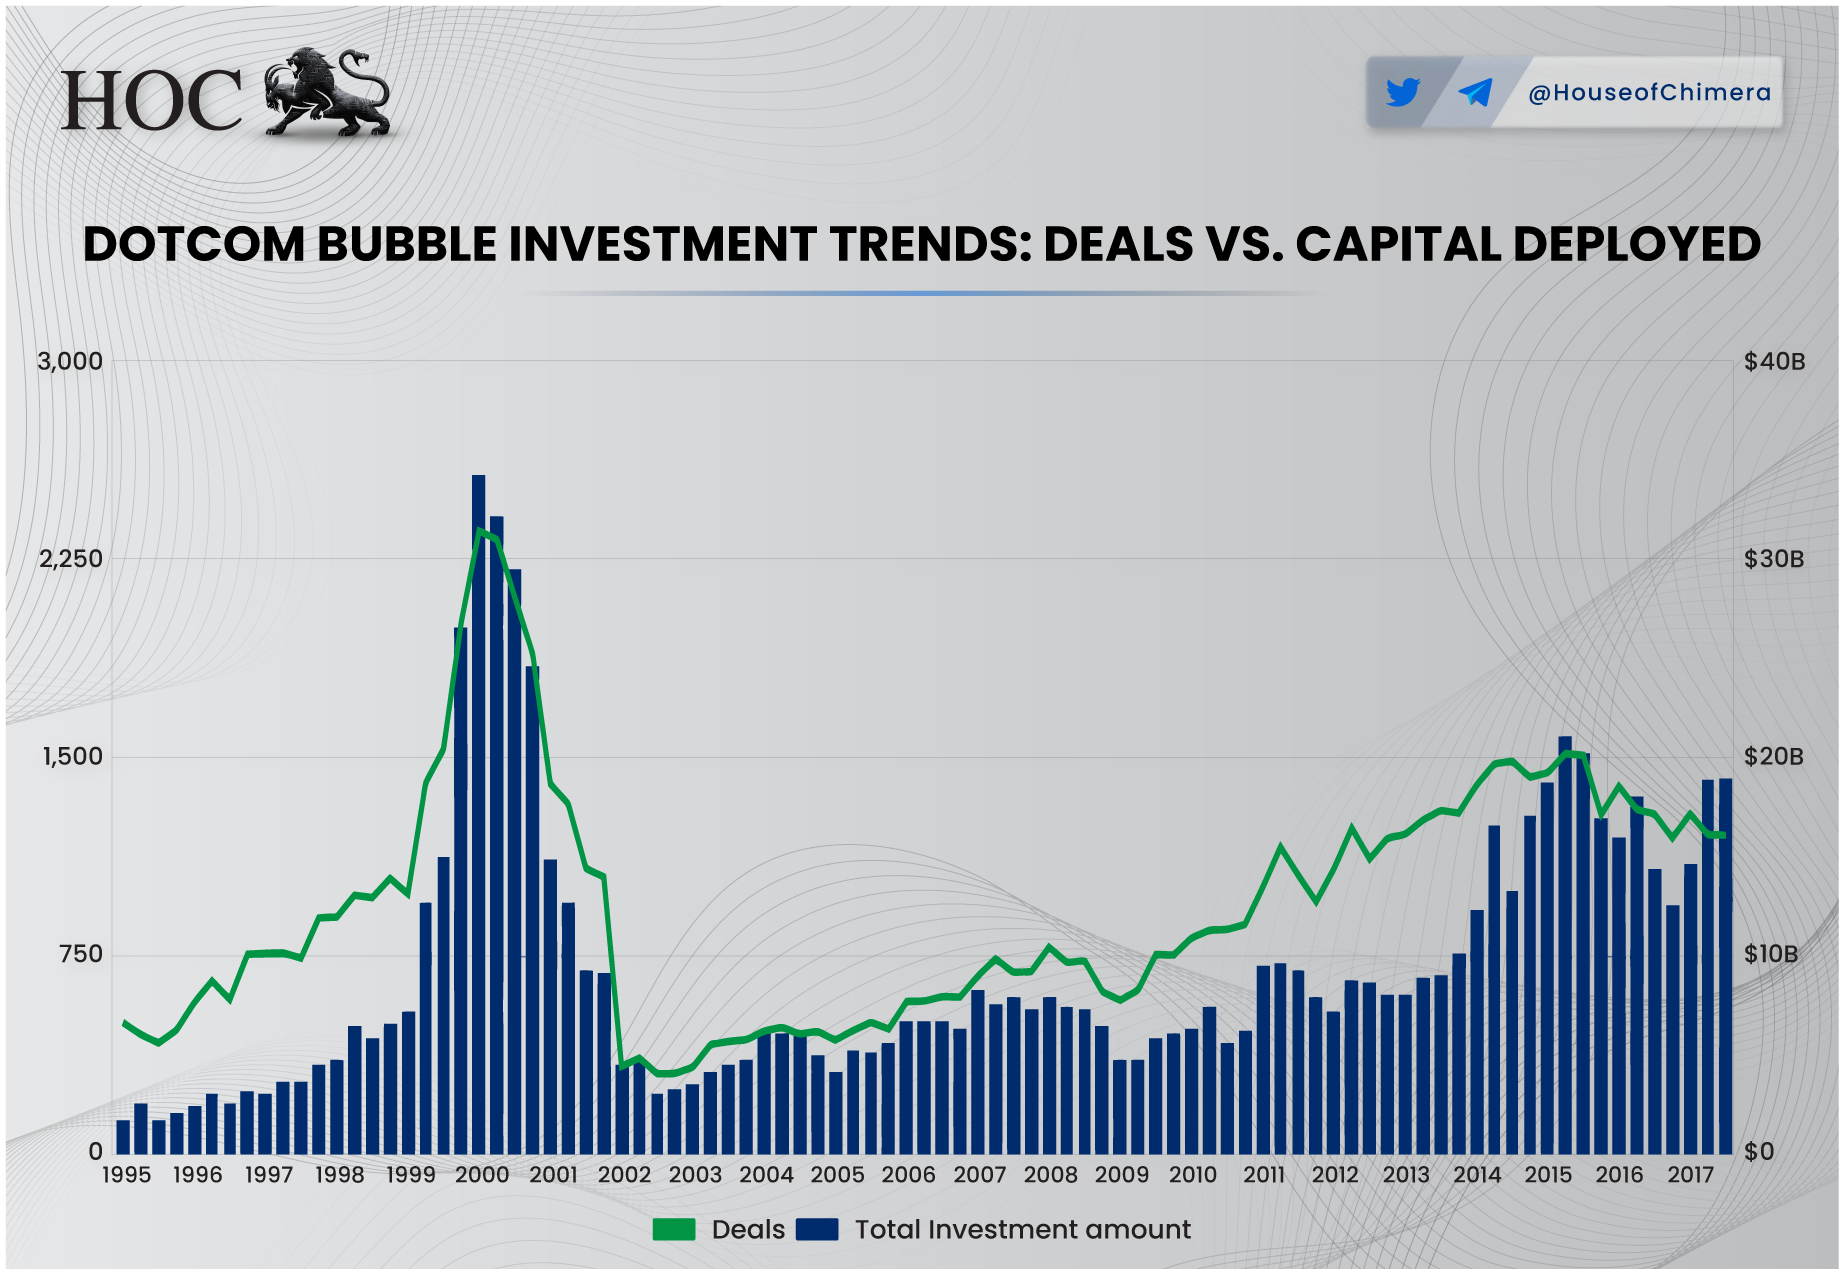
Based on the current data, a different pattern is observable. The Bitcoin price increases, while the overall total investment amount is lacking. This differs from what one saw with the Dotcom Bubble, as prices and the total investment amount were correlated.
This makes you wonder, what makes the cryptocurrency industry different from the traditional finance sector?
This time it is ‘different’
One of the most notable shifts in the 2024–2025 cycle is the changing makeup of market participants. The approval of U.S. Bitcoin spot ETFs in January 2024 marked a turning point, fundamentally altering market dynamics. In previous cycles, altcoins typically fueled bull runs. As Bitcoin rallied, its dominance would gradually decline as investors rotated into increasingly risky altcoins, driven by FOMO and the search for outsized returns. Eventually, as the risk-reward ratio became less favorable, sentiment would shift, and capital would flow back into Bitcoin as a comparatively more stable asset. This cyclical pattern was evident in both the 2017–2018 and 2021–2022 market cycles.
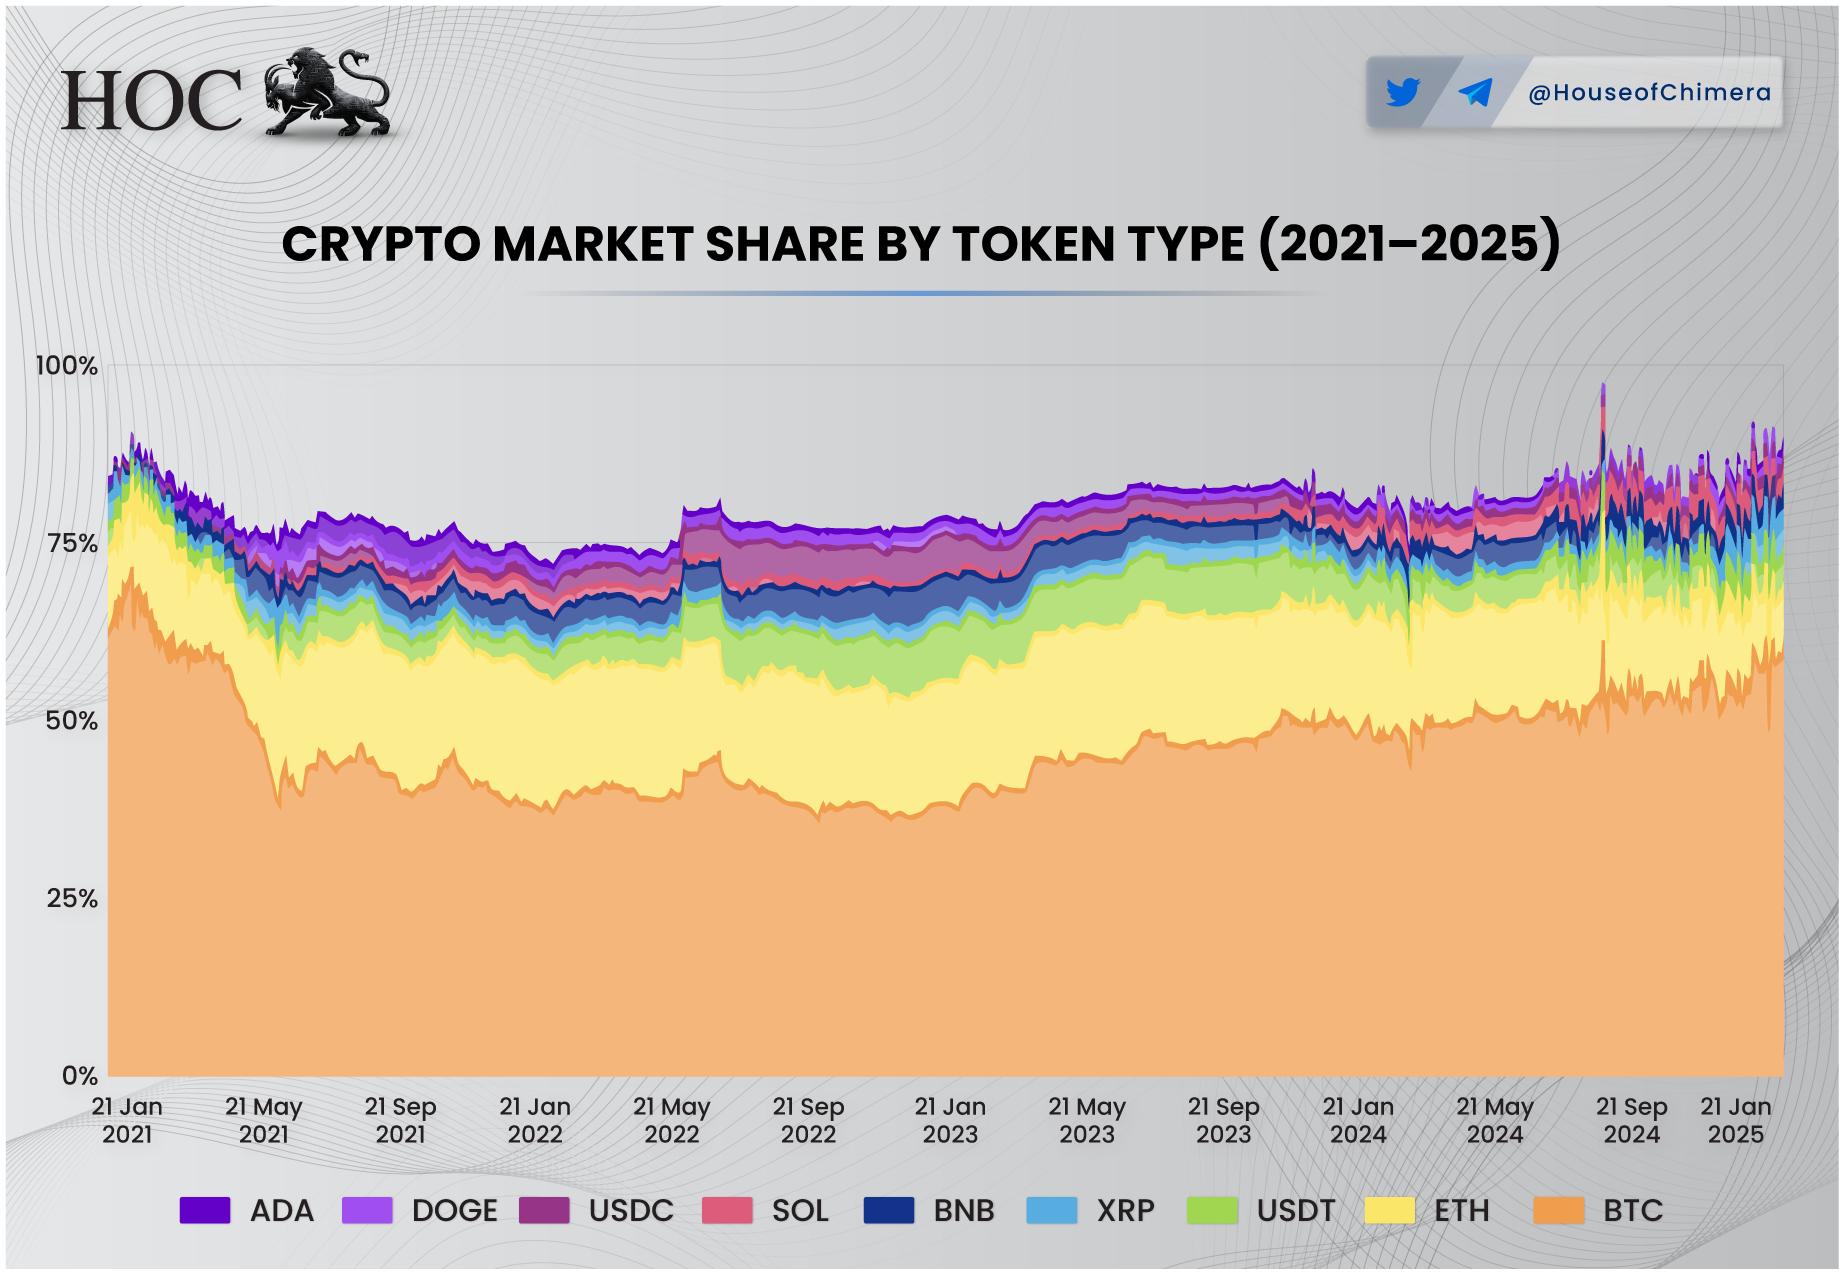
However, the current cycle is breaking that pattern. Since the Bitcoin spot ETFs' launch, Bitcoin dominance hasn’t declined; instead, it has continued to rise. As a result, many altcoins, including Ethereum, have failed to capture meaningful attention this time around. The few altcoin standouts have been chiefly confined to specific ecosystems, such as Solana, Hyperliquid, and Ton. This divergence is primarily due to ETF-driven capital flows focused solely on Bitcoin, with little spillover into the broader altcoin market. As a result, altcoins have been increasingly sidelined, a trend that mirrors the ongoing decline in fundraising activity across the sector.
Many altcoins now appear ‘cheap’ by historical standards, but they may remain that way for some time without renewed demand. As long as the spotlight remains fixed on Bitcoin through institutional products like ETFs, altcoins are unlikely to see a broad resurgence in investor interest.
Venture capitalists may have held back on funding despite Bitcoin’s rise due to a broader sense of market overconfidence. Many investors assumed the current cycle mirrored that of 2021, expecting altcoins to follow Bitcoin’s lead and surge in value. But that scenario never played out. As altcoins underperformed, retail investors increasingly turned to riskier assets—eventually flocking to memecoins. This shift resembled a leveraged bet, as memecoins are notoriously volatile and often operate more like a casino than a sound investment. The hype was further fueled by viral stories of individuals, even teenagers, making thousands or even millions through memecoin trading—often through questionable means like insider trading. This created a wave of irrational optimism, with the prevailing sentiment being: “Just buy a memecoin, and you’ll get rich.” In reality, the odds were overwhelmingly against the average investor—more on that in the next paragraph.
Altcoins and bubble characteristics
This brings us to the first defining trait of a bubble: irrational exuberance. The current cryptocurrency cycle reflects this, as investor attention shifted away from utility and fundamentals toward speculative bets on celebrity memecoins. The trend escalated to the point where even the sitting U.S. President, Donald Trump, launched his own memecoin, along with one for his wife, Melania Trump. Several other celebrities followed suit, often ending in rug pulls, including $HAWK by Hailey Welch, $JASON by Jason Derulo, and $MOTHER by Iggy Azalea, which is now linked to questionable gambling content.
This wave of celebrity-driven speculation attracted a large influx of new retail participants, primarily through platforms like TikTok, where these tokens were heavily promoted. For many, this was their first interaction with blockchain technology. The situation reached a new low when a 13-year-old launched a memecoin via Pump.fun, rugged it for $30K, and then repeated the scam with a coin meant to apologize for the initial rug. The fear of missing out (FOMO) became so extreme that bad actors increasingly exploited the frenzy.
Memecoins function as a high-risk speculative market, often resembling a rigged casino. They are roughly 50 times more volatile than Bitcoin; nearly 40% are identified as pump-and-dump schemes. One study found that just 0.11% of tokens launched on Pump.fun survive beyond the first 24 hours. This demonstrates how irrational exuberance combined with FOMO has led to a massive value extraction from inexperienced investors.
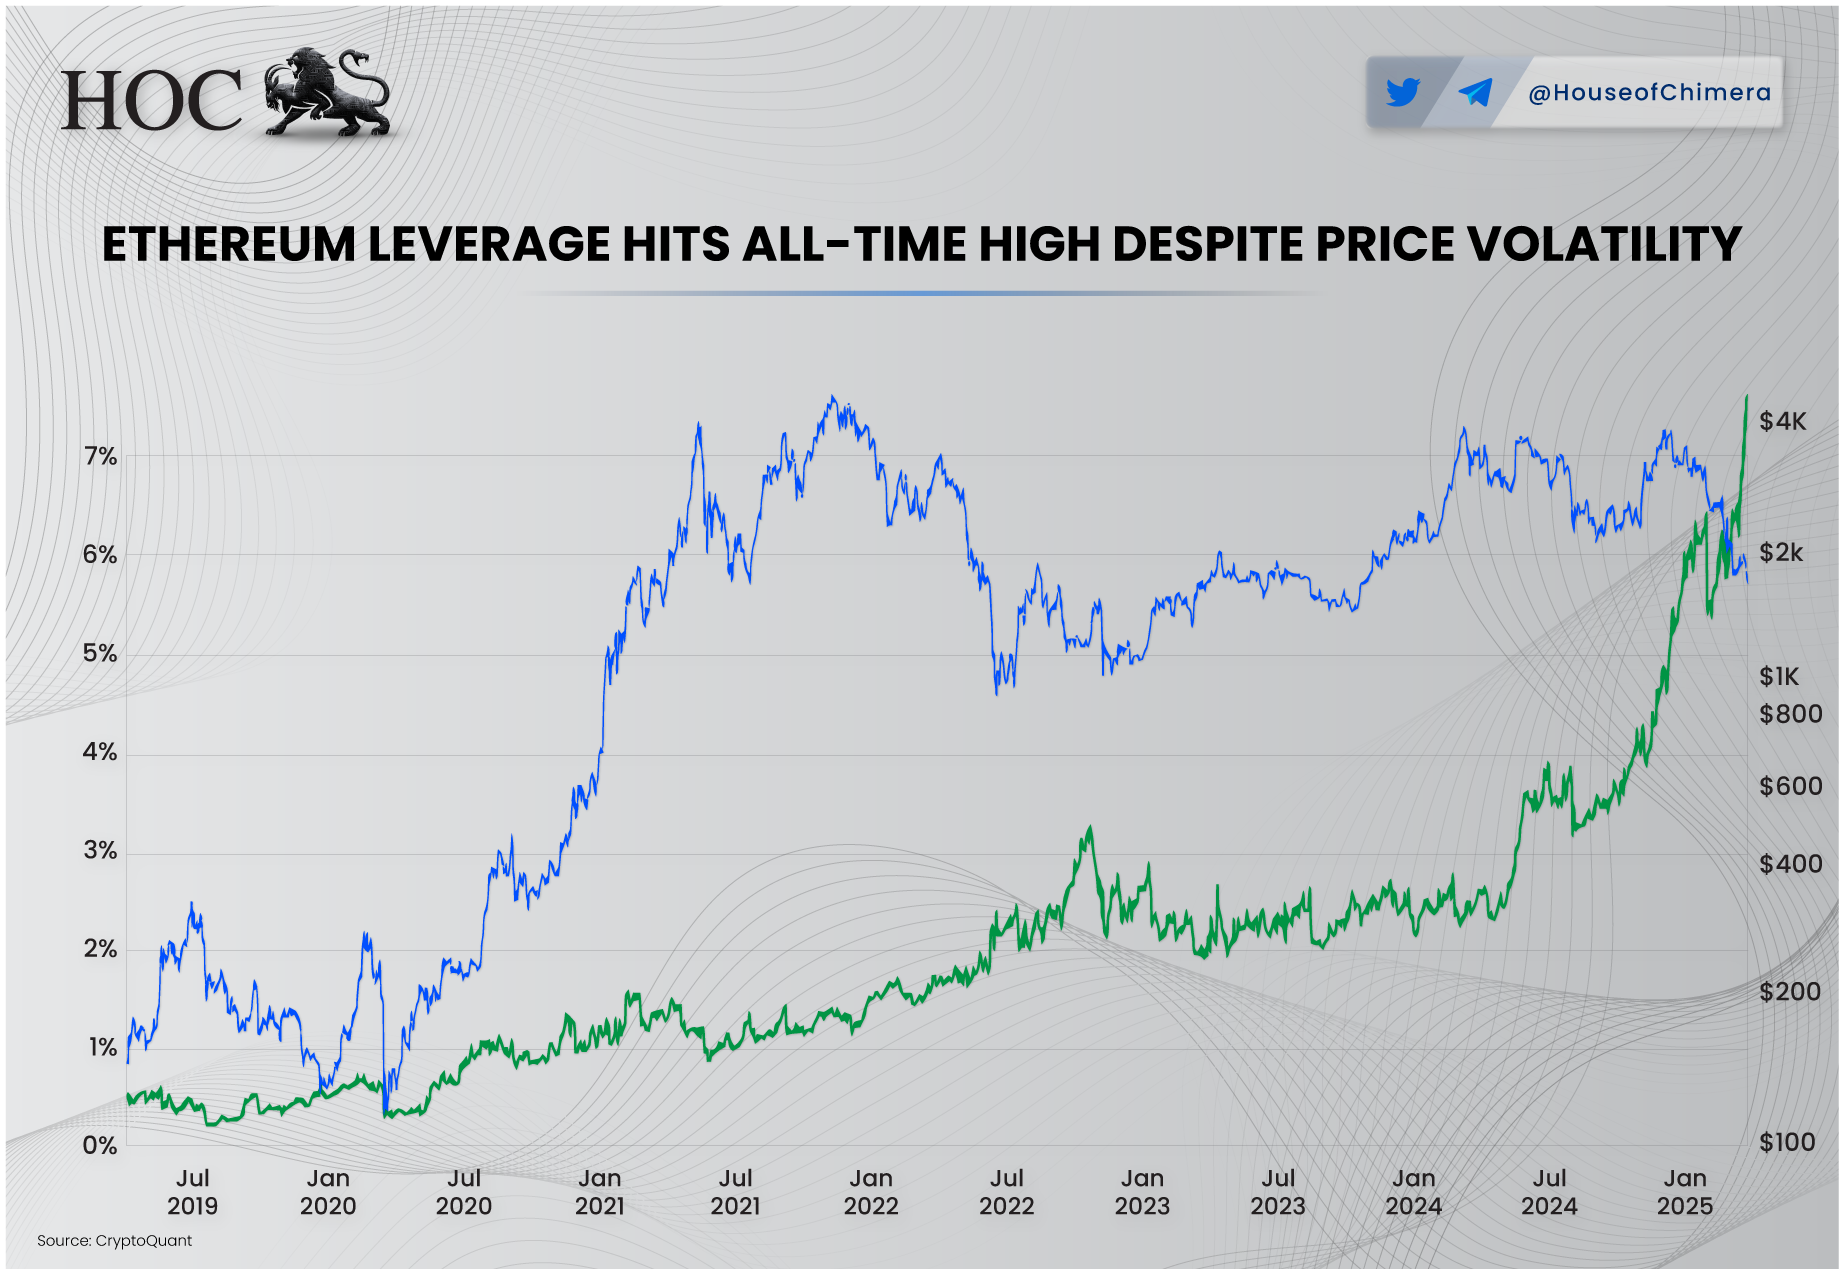
Broader market trends indicate a growing risk appetite. Ethereum has reached peak estimated leverage, even as open interest slightly declined after a significant price drop. This suggests more users are borrowing funds to amplify their exposure. However, such high leverage increases the market's fragility—even minor price swings can trigger outsized reactions, potentially resulting in a sharp market-wide liquidation event. On the other side, this can be seen as conviction, as investors are increasing their leverage here, as they might see Ethereum as being valued ‘cheap’ here, which one could argue for. However, it also puts them at a highly vulnerable position.
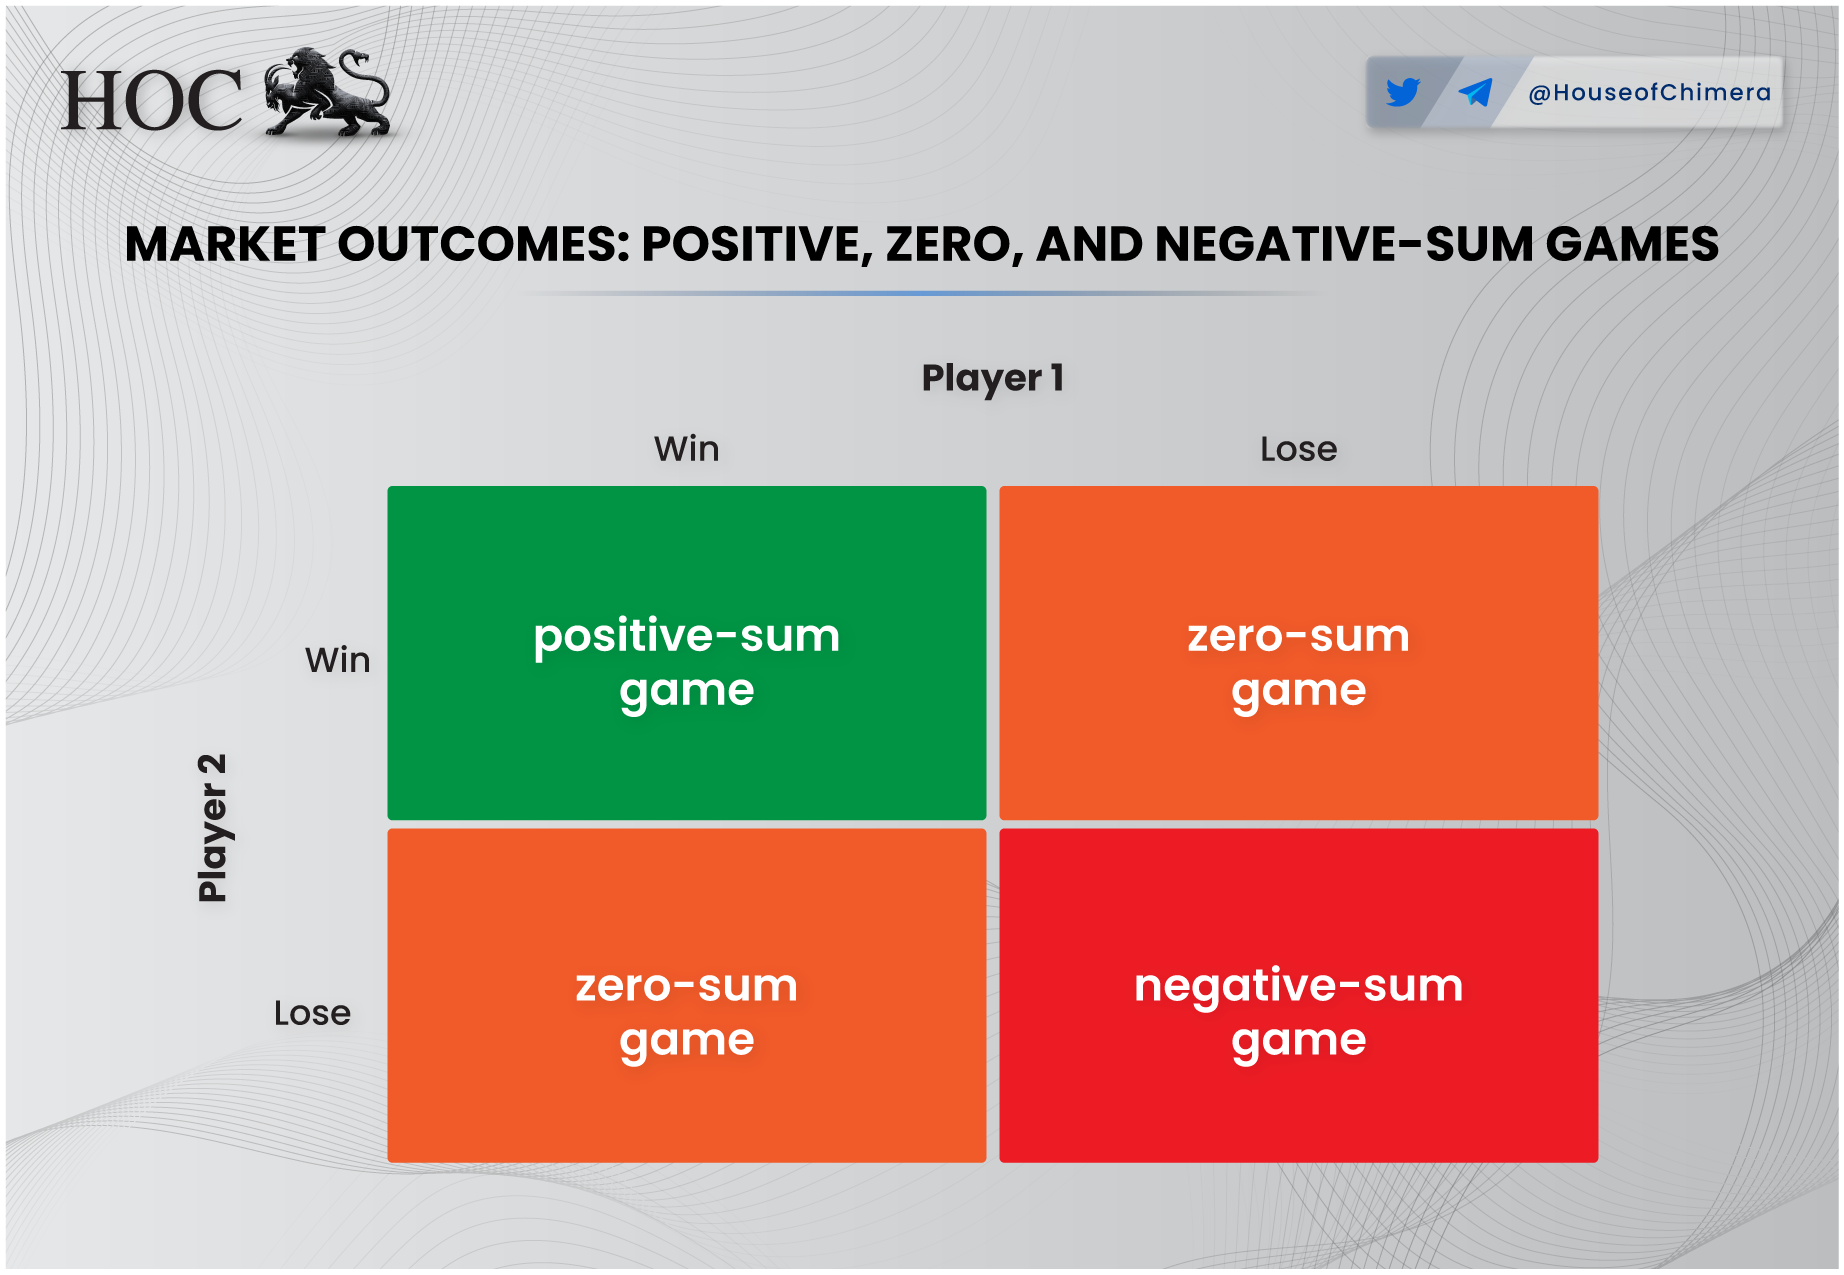
Now, before the inevitable question arises—“So are all altcoins just bubbles?”—the answer requires nuance. There are gradations. Memecoins are a textbook example of a negative-sum game, where the vast majority lose and a small group walks away with profits, often at others’ expense. Most participants will lose money, creating a lose-lose dynamic. That said, not all altcoins are inherently flawed. Some projects do generate revenue, albeit modestly. However, many altcoin markets consist of projects with no revenue and likely no path to sustainability. Still, this isn’t a uniquely “crypto” issue. The tech industry broadly faces similar dynamics, where roughly 90% of startups fail within the first five years.
The Flight to Quality
The name of the game has changed. For years, Bitcoin and altcoins moved near lockstep, rising and falling as one broad, speculative asset class. But that dynamic is shifting. Since the approval of Bitcoin Spot ETFs, the market has begun to treat Bitcoin differently. It’s no longer just the crypto market leader — it’s starting to look like its own asset class within the digital asset ecosystem.
While correlations between Bitcoin and altcoins still exist, they are weakening. Bitcoin's rallies have become steeper, more consistent, and increasingly decoupled from the rest of the crypto market. Meanwhile, altcoin markets remain sluggish, with capital inflows diminishing and funding rounds slowing down. What we're witnessing is an apparent liquidity rotation.
This rotation reflects a broader investor preference shift — away from speculative altcoins and toward assets with perceived staying power. As the most resilient and liquid digital asset, Bitcoin benefits from this reallocation. This behavior isn’t unique to crypto. In times of uncertainty, traditional and crypto investors tend to retreat to what they perceive as “safer” assets — a phenomenon known as a flight to quality. Historically, gold has played this role. Today, Bitcoin aims to join that category, which is now more accessible than ever through regulated investment vehicles like ETFs.
This shift doesn't spell the end for altcoins but changes the market dynamics. With lower overall funding and weaker inflows, altcoin projects face a more selective environment. The days of speculative mania may be over — at least for now — and only projects with straightforward utility, strong narratives, or deep liquidity will likely thrive.